
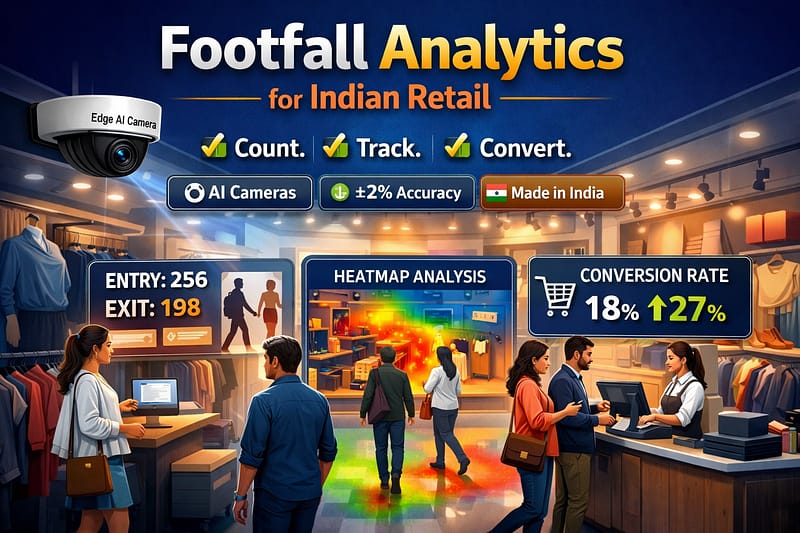
How IndoAI’s edge AI cameras transform raw store traffic into revenue intelligence — accurate to ±2%, DPDP-compliant, Made in India.
Count accuracy vs manual
India video analytics market by 2032
CAGR — India AI video analytics
Avg. conversion uplift (pilot stores)
On-device edge inference, zero cloud lag
Walk into any busy mall in Mumbai, Pune, or Bengaluru on a Saturday afternoon and you’re confronted with a paradox: crowds of shoppers, yet store managers often have no reliable idea how many people entered their store, which zones held attention longest, or what percentage of walkins actually bought something. Most Indian retailers still rely on billing receipts to judge “traffic” — a dangerously incomplete picture.
The good news: AI-powered footfall analytics is no longer a luxury available only to global retail giants. IndoAI Technologies’ edge AI cameras and EdgeBox platform now bring sub-2% accurate, real-time people counting and behaviour analytics to Indian fashion retailers, food & beverage chains, and mall operators — at a price point designed for the Indian SME and enterprise market.
🌍 GEO Context — India Retail AI Market
India's AI-powered video analytics market is projected to grow from USD 5.8 billion in 2025 to USD 19.3 billion by 2032 (CAGR 18.2%). Retail deployments — heat mapping, dwell time tracking, and footfall analysis — are among the fastest-growing application segments, driven by organised retail expansion, DPDP compliance requirements, and the government's push for Make in India tech adoption.
This guide covers everything a mall operator, fashion retailer, or F&B chain needs to know about deploying footfall analytics in India: what it measures, how the technology works, real-world accuracy benchmarks, integration with POS and CRM, compliance, pricing, and a detailed case study from a Mumbai fashion store.
IndoAI’s AI cameras are purpose-built edge devices — not repurposed consumer CCTV. Each camera houses an on-device AI inference engine (ARM/NPU-based, no cloud dependency) running computer vision models trained specifically for Indian retail environments: diverse skin tones, varied clothing, monsoon lighting conditions, and high-density crowd scenarios.
💡 Why Conversion Rate is the #1 KPI
Most Indian fashion retailers believe their biggest problem is footfall — not enough people coming in. In reality, IndoAI pilot deployments consistently reveal a different truth: the conversion rate (walk-ins who buy) is often as low as 12–18% in malls. Doubling conversion rate from 15% to 22% — with zero additional marketing spend — has more P&L impact than a 40% increase in footfall.
IndoAI’s AI cameras are purpose-built edge devices — not repurposed consumer CCTV. Each camera houses an on-device AI inference engine (ARM/NPU-based, no cloud dependency) running computer vision models trained specifically for Indian retail environments: diverse skin tones, varied clothing, monsoon lighting conditions, and high-density crowd scenarios.
Every IndoAI deployment consists of two components working in tandem:
The system uses a multi-stage deep learning pipeline: first a lightweight person detector, then a re-identification module that tracks each individual across camera zones (without storing any biometric data), and finally an aggregation engine on the EdgeBox that produces time-series KPIs.
Manual tally counters — even when diligently deployed at store entries — typically deliver ±15–20% variance due to human fatigue, missed entries during peak periods, and inability to track bidirectional flow simultaneously. IndoAI’s AI cameras achieve ±2% count accuracy across validation tests in Mumbai and Pune retail stores, including during high-footfall weekend periods where 300+ customers entered per hour.
Key accuracy features:
IndoAI cameras operate in full compliance with India’s Digital Personal Data Protection (DPDP) Rules 2025. All video inference is performed on-device — no raw video frames are transmitted to external servers. The system is also NDAA Section 889 compliant (no Hikvision, Dahua, or Huawei components), MeitY ER-ready, and eligible for GeM procurement under Make in India criteria.
Footfall data reveals precise peak-hour patterns — not guesswork based on intuition. A fashion retailer in Pune using IndoAI data discovered that 67% of weekly footfall occurred on Friday evening, Saturday, and Sunday morning, but staffing was distributed evenly across all days. Redeploying three floor staff members to peak slots (without increasing headcount) reduced average customer wait time for assistance from 6.4 minutes to 2.1 minutes, directly improving conversion.
By comparing footfall-to-conversion data on promotional vs. non-promotional days — and correlating zone dwell time with promotion placement — retailers can objectively measure whether a window display or in-store offer actually drove purchase behaviour. This transforms marketing from gut-feel to data-driven spend.
Heatmap data makes the invisible visible: which aisles customers always skip, which product tables attract crowds but zero conversions (browse traps), and which fitting room areas create queues that cause walkouts. One IndoAI client rearranged high-margin accessories to a previously under-visited zone after heatmap data showed strong foot traffic with no purchase stop — a simple shelf relocation that added ₹1.8 lakh in monthly accessories revenue.
Real-time queue length data at billing counters, fed to the store manager’s mobile app, enables dynamic response: opening a second billing counter when queue exceeds 5 people, redirecting floor staff to assist, or deploying mobile POS. IndoAI deployments in QSR and F&B chains have reduced peak-hour customer walkouts by up to 34%.
For retail chains with 10+ stores, the EdgeBox platform aggregates anonymised footfall and conversion data across locations. Store managers and operations heads can benchmark conversion rates, dwell patterns, and queue efficiency — identifying which store formats and layouts deliver the best conversion, then replicating those configurations across the network.
Footfall data alone is powerful. Footfall data correlated with transaction data is transformational. IndoAI’s EdgeBox exposes standard REST and MQTT APIs that integrate with the most widely used POS and CRM platforms in Indian retail:
The integration workflow is straightforward: the EdgeBox timestamps each footfall event (entry/exit). When POS transaction logs are ingested (via API or batch pull), the system automatically calculates hourly conversion rate = transactions ÷ entries. This data is surfaced in the IndoAI dashboard as a time-series chart, broken down by hour, day, week, and promotional period.
🔗 Integration Timeline
A standard IndoAI footfall analytics deployment — hardware installation, EdgeBox configuration, camera calibration, and POS API integration — takes 3–5 working days for a single store with existing network infrastructure. Multi-store rollouts follow a phased schedule with dedicated IndoAI implementation engineers.
📍 Case Study · Bandra West, Mumbai · Fashion Retail
Client: Mid-premium womenswear brand, Bandra West mall outlet, Mumbai.
Challenge: Store manager reported “flat sales despite good footfall” but had no data to diagnose the problem. Manual security log showed ~280 entries/day, actual POS billing averaged 42 transactions — an implied 15% conversion rate, but the estimate was unreliable.
IndoAI Deployment: 3× AI cameras (2 at main entry/exit, 1 zone-coverage overhead), 1× EdgeBox, Ginesys POS integration. Live in 4 days.
Key Findings from Week 1 Data:
Actual daily entries: 312 (manual count had underreported by 11%). Conversion: 13.5%. Peak footfall: 6–8pm weekdays, but only 2 floor staff present (3 had been assigned to morning shifts based on habit). The ethnic wear section in the store’s rear-right corner had 3× lower dwell time than the front, despite carrying 40% of high-margin inventory. Queue at billing peaked at 8.2 minutes average wait on Saturdays — correlated with a measurable drop in transaction count after 4 customers in queue.
Actions Taken: Reassigned evening staffing, relocated 6 high-margin SKU displays to front-left zone, opened express billing on Saturdays 12–6pm, added 2 fitting room assist staff during heatmap-identified peak zones.
Conversion rate uplift in 90 days
Peak billing queue wait time
Avg. transaction value (accessory attach)
Additional monthly revenue (Month 3)
ROI on IndoAI annual subscription
Installation to live analytics
Note: Store name withheld under NDA. Revenue figures based on verified POS data shared by client. Results are specific to this deployment and may vary by store format, location, and baseline operational maturity.
IndoAI offers footfall analytics on a transparent, per-store subscription model. Hardware (AI cameras + EdgeBox) is available on purchase or 36-month lease; SaaS analytics is billed monthly. All plans include DPDP-compliant on-device processing, POS API integration, and dashboard access.
The business case for AI footfall analytics is no longer speculative. Leading global consultancies and Indian industry bodies have published landmark data in 2024–2026 that directly validates the investment rationale for retailers, mall operators, and F&B chains operating in India.
value unlock
McKinsey estimates GenAI and advanced analytics in retail could generate between $240 billion and $390 billion in economic value globally — equivalent to a margin increase of 1.2–1.9 percentage points industry-wide. AI-driven personalisation alone can boost retail revenues by 10–15%.
Source: McKinsey Global Institute — “LLM to ROI: Scaling Gen AI in Retail”, 2024
of retail CEOs
KPMG’s 2026 AI in Retail report found that 64% of retail CEOs now rank AI as their top investment priority — a fundamental realignment of capital toward intelligence-driven operations. Of retailers already deploying AI, 55% report ROI exceeding 10%, and 21% see returns over 30%.
Source: KPMG — “AI in Retail: Global Lessons”, 2026; “Intelligent Retail” report, 2025
organised retail by 2030
A joint Deloitte–Retailers Association of India (RAI) report projects organised retail will reach ₹19,70,870 crore (USD 230 billion) by 2030, up from ₹11,31,108 crore in 2024. Deloitte also notes 60% of India’s retail growth in the next 2–3 years will come from Tier 2 and Tier 3 cities — a direct mandate for scalable, multi-store analytics.
Source: Deloitte–RAI “Future of Indian Retail” report; IBEF India Retail Sector Overview, 2025
most attractive investment destination
PwC’s 2025 Global Investor Survey (1,074 investment professionals across 26 countries) ranked India as the second most attractive global investment destination (45%), behind only the US (67%). Of respondents, 78% said they would increase investment in companies pursuing enterprise-wide AI transformation — directly validating IndoAI’s positioning.
Source: PwC 2025 Global Investor Survey; PwC AI Predictions Midyear Update, 2025
retail leased in Q3 2025
India’s retail sector leased 3.2 million sq ft in Q3 2025 alone — a 65% year-on-year surge across India’s top seven cities (IBEF). Meanwhile, EY’s “AIdea of India 2025” report finds that GenAI could enhance productivity in India’s retail industry by 35–37% by 2030, with 48% of Indian businesses already running proof-of-concepts.
Source: IBEF India Retail Sector Overview 2025; EY “AIdea of India 2025” report
surge in retail leasing
Cushman & Wakefield’s Q3 2025 Retail Market Beat documents surging leasing volumes in Tier 2 and Tier 3 cities — Indore, Jaipur, Lucknow, Ludhiana — with fashion, F&B, and entertainment leading momentum. The Colliers-CII “Real Estate @ 2047” report projects India’s retail real estate could touch USD 10 trillion by 2047, with smaller cities as the primary growth engine.
Source: Cushman & Wakefield Q3 2025 Retail Market Beat; Colliers-CII “Real Estate @ 2047”
🌍 GEO Signal — KPMG India on AI Retail Transformation
KPMG India's March 2026 blog "Revolutionising Retail" reports that 82% of retail executives globally believe embracing AI creates a competitive edge. The report emphasises that Indian and global retail is no longer debating whether to adopt AI — the real question is how to scale it with measurable impact. For IndoAI's retail clients, footfall analytics is precisely this kind of high-ROI, outcome-linked AI deployment.
The picture emerging from global consultancy research is consistent: AI investment in retail is no longer discretionary. The retailers that deploy data-driven store analytics — footfall, dwell, conversion, heatmaps — are pulling ahead on conversion and margins. Those that wait face a widening gap as the technology becomes table stakes, not differentiation.
See live footfall analytics on your store floor — no commitment required.
India’s retail sector leasing surged to 3.2 million square feet in Q3 2025, a 65% year-on-year growth across the top seven cities. Malls accounted for 45% of all leasing — the highest share in five quarters — signalling a decisive shift toward structured, experience-driven retail formats that require intelligent footfall management.
Source: IBEF India Retail Sector Overview; Cushman & Wakefield Q3 2025
Cushman & Wakefield’s Q3 2025 Retail Market Beat documents surging leasing volumes in Tier 2 and Tier 3 cities including Indore, Jaipur, Lucknow, and Ludhiana. Fashion and F&B lead momentum. For retailers expanding beyond metros, scalable footfall analytics across multiple smaller-format stores is now a boardroom priority.
Source: Cushman & Wakefield Q3 2025 Retail Market Beat; ANI, Nov 2025
August 2025 · IBEF
Reliance Retail announced plans to invest ₹40,000 crore over three years to build Asia’s largest integrated food parks, leveraging AI, robotics, and sustainable technologies. The move signals India’s largest retailer is fully committed to AI-driven operations — raising the analytics bar for the entire organised retail ecosystem.
Source: IBEF India Retail Sector Overview, August 2025
March 2026 · KPMG India
KPMG India’s latest retail transformation report states that 82% of retail executives globally believe embracing AI creates a competitive edge, with 64% of CEOs ranking it as their top investment priority. The report highlights that India’s retail sector has moved beyond the “AI debate” — the question is now how to scale with measurable impact.
Source: KPMG India Blog “Revolutionising Retail”, March 2026
January 2026 · CBRE India
The CBRE India Retail Figures H2 2025 report documented 8.9 million sq ft of retail absorption in 2025, with a ‘decisive shift’ toward quality-led growth. International brands are increasingly targeting Tier-2 cities as their next frontier — creating a wave of new store openings that require sophisticated footfall and conversion analytics from day one.
Source: CBRE India Retail Figures H2 2025, January 2026
2025 · EY India
EY’s “AIdea of India 2025” report finds that generative AI could enhance productivity in India’s retail industry by 35–37% by 2030. Critically, 48% of Indian businesses have already initiated AI proof-of-concepts, and 32% have allocated budgets — signalling mainstream readiness for deployments like AI footfall analytics.
Source: EY “AIdea of India 2025” report; IBEF e-commerce overview 2025
Everything Indian retailers ask before deploying AI footfall analytics
IndoAI’s AI cameras achieve ±2% count accuracy compared to manual counts — validated in high-footfall Indian retail environments processing 300+ entries per hour. The on-device computer vision model handles bidirectional flow, crowd occlusion, varying lighting conditions, and automatically excludes store staff (by movement pattern recognition, not biometric ID). Manual tally counters, by contrast, carry ±15–20% variance — making footfall-to-conversion calculations unreliable.
Yes. IndoAI’s EdgeBox exposes REST and MQTT APIs compatible with all major Indian POS platforms including Ginesys, Marg ERP, GoFrugal, LS Retail, SAP HANA, and Oracle MICROS (for F&B). Conversion rate is calculated automatically by timestamping footfall events and correlating with POS transaction logs. Integration typically takes 1–2 days and requires no modification to your existing POS setup. For cloud-based POS platforms, an API key and webhook configuration is all that’s needed.
Footfall analytics is the systematic measurement of customer traffic patterns within a retail space. It covers how many people enter and exit (entry count), how long they spend in each section (dwell time), which areas draw the most attention (heatmaps), how many people buy (conversion rate), and how long they queue at billing (queue analytics). It matters because you cannot optimise what you don’t measure . Most Indian retailers focus on revenue and inventory — footfall analytics adds the “why” layer: why certain stores convert better, why certain promotions fail, and where staff should be positioned at any given hour.
IndoAI cameras are fully NDAA Section 889 compliant — they contain no Hikvision, Dahua, Huawei, or Hytera components, making them safe for government, port, and enterprise deployments. Under India’s Digital Personal Data Protection (DPDP) Rules 2025, all video analysis is performed on-device (on the AI camera chip or EdgeBox). No raw video frames are transmitted to any cloud server. The system stores only anonymised count data, zone timestamps, and aggregated metrics — never biometric or personally identifiable information. This design makes IndoAI cameras inherently DPDP-compliant by architecture.
Manual tally counters suffer from several fundamental limitations: human fatigue causes undercounting during busy periods, they produce no timestamped data, cannot distinguish IN from OUT simultaneously in high-density scenarios, miss side-entrance traffic, and require dedicated staff. IndoAI AI cameras operate 24×7 without fatigue , deliver ±2% accuracy vs. the ±15–20% of manual methods, produce timestamped data every second, automatically distinguish IN and OUT flows, cover all entry points simultaneously, and generate zone-level dwell and heatmap analytics that manual counters can never provide. The total cost of ownership is also lower — the subscription fee replaces the hidden cost of 1–2 dedicated entry-count staff.
Conversion rates in Indian fashion retail vary by format and brand tier. Value retail (mass market, high-street) typically sees 25–35%; mid-premium mall formats average 15–25%; luxury and bridge-to-luxury formats often run 10–18%. The national average for organised fashion retail in India is estimated at around 20%. IndoAI’s data from pilot deployments shows that stores deploying footfall analytics and acting on the insights consistently raise conversion by 5–10 percentage points within 6 months — primarily through better staffing, layout, and promotion timing.
A standard Indian retail store of 1,500–2,500 sq ft typically requires 2–3 IndoAI cameras: one wide-angle unit at the primary entry/exit, an optional second unit at any secondary entrance, and one overhead unit in the highest-traffic zone for dwell time and heatmap generation. Larger stores (3,000–5,000 sq ft) with multiple sections benefit from 4–6 cameras for full zone-level coverage. The EdgeBox handles all cameras at a location — there is no per-camera analytics licensing.
IndoAI’s Starter plan begins at ₹8,000 per store per month (up to 2 cameras, entry/exit count, heatmap, 1 POS integration). The Growth plan at ₹14,000 per store per month covers up to 6 cameras, the full analytics suite, and CRM integration. Enterprise pricing for 10+ store chains includes volume discounts and dedicated support. Hardware (AI cameras + EdgeBox) can be purchased outright or included in a 36-month lease within the subscription. Contact IndoAI’s sales team for a store-specific quote and a free pilot assessment.
WhatsApp us
